The United States of Debt: The Fiscal Future of America Is Increasingly Bleak
There has been talk in Congress recently of the creation of a “fiscal commission,” or “debt commission,” to address the serious fiscal challenges that face the United States. Of course, there’s opposition to the idea from various special interest groups, including opposition from progressive organizations, that believe a fiscal commission will mean cuts to scheduled benefits for current beneficiaries of Medicare and Social Security.
FreedomWorks has strongly supported the creation of a fiscal commission and will continue to do so. In September, we signed a bipartisan letter organized by the Committee for a Responsible Federal Budget in support of a fiscal commission and have engaged with the House Budget Committee, which has held hearings on the topic, including the hearing that was held on November 29.
Currently, there are a handful of bills that would create a fiscal commission. Those bills are the Sustainable Budget Act (H.R. 710 and S. 743), the Fiscal Commission Act (H.R. 5779), and the Fiscal Stability Act (S. 3262). The House Budget Committee will explore these bills at this week’s hearing. Each of the bills handles the fiscal commission differently, but they all represent the beginning of a much-needed conversation on the modernization of trust fund programs that Americans need to have. Importantly, each bill is bipartisan, and each bill would require the commission to make recommendations to put the United States on a sustainable path.
Recently, Social Security Works tweeted a letter that had the support of more than 100 organizations—including the AFL-CIO, the American Postal Workers Union, the International Brotherhood of Teamsters, MoveOn.org, and Public Citizen—that expressed opposition to the creation of a fiscal commission. The letter states, “[W]e consider support for a debt commission to be support for cutting Social Security.”
Let’s be clear here. There isn’t anyone—literally no one in Congress or outside of Congress—who supports cutting benefits for current beneficiaries of Medicare or Social Security. Preserving benefits for those who depend on these programs is precisely why we’re pushing so hard for the modernization of the program. Any changes, though, wouldn’t impact those who are currently receiving benefits or close to the age of receiving benefits.
The fiscal problems that the United States faces are real and are staring us down unless Congress finds the political will to address the drivers of budget deficits and debt. We need to level-set the discussion, get away from the partisan noise, and dive into what’s on the horizon if Congress does nothing.
Note: All numbers in future years mentioned here are projections. Projections found in this post come from several federal agencies, including the Congressional Budget Office and the Census Bureau. Considering how far into the future some projections run, unforeseen events, changes in law, and other factors can’t be measured. Those unforeseen factors can and will have an impact on the projections. Data in this post come from various sources, including the Congressional Budget Office’s Long-Term Budget Outlook and The Demographic Outlook: 2023-2053.
Debt Is a Threat to the United States
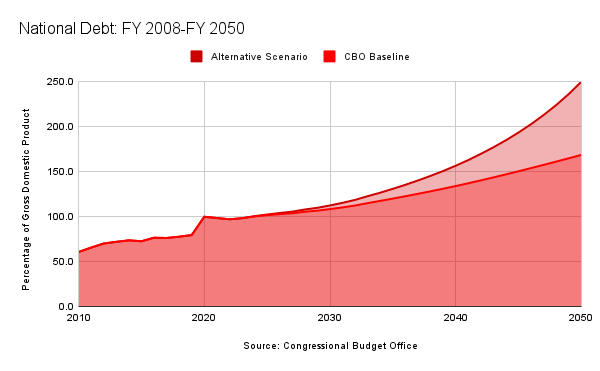
It’s mind-blowing to think that as recently as FY 2008, the United States’ debt to gross domestic product (GDP) ratio was lower than 40 percent. That debt-to-GDP ratio undoubtedly lulled members of Congress into a sense of complacency when it came to the long-term challenges with trust fund programs. Then came the fiscal response to the Great Recession—which included a bailout of financial institutions deemed “too big to fail,” auto manufacturers, and a stimulus program—and debt began to pile up. In FY 2017, debt was 76.2 percent of GDP.
Why does debt to GDP matter? First, it’s an indication of how much a country is essentially putting on its credit card. If a country borrows too much, credit rating agencies like Fitch, Standard and Poor’s, and Moody’s will downgrade the country’s credit rating. This leads to higher interest rates to borrow and, potentially, fewer investors (private individuals, hedge funds, central banks, and foreign governments) will be willing to purchase securities because they’ll question the ability of the country to pay back the debt and interest owed.
Greece is probably the best example of this. In 2009, credit rating agencies downgraded Greece’s credit rating, which, as the country faced default on its debt, led to a series of austerity measures—a mix of spending reforms, cuts, and tax increases—that began in February 2010 and ended in January 2018, as well as substantial financial assistance from the European Union, European countries, and the International Monetary Fund. Greece’s debt-to-GDP ratio had exceeded 100 percent when it began experiencing these problems. The country’s debt-to-GDP ratio is still incredibly high, but it’s on a downward trajectory. However, Greece probably isn’t out of the woods yet.
For the sake of space, because there’s a lot to go over in this post, we’re not capturing the extent of the problems or the political drama and protests that took place in Greece because of the austerity measures passed by the Hellenic Parliament over nearly eight years.
Similarly, there’s currently some attention being given to Italy, which has a debt of 143.7 percent of GDP. Although Italy’s debt was larger when it went through a sovereign debt crisis, other issues at play could cause significant problems in the broader Eurozone.
The United States had a debt-to-GDP ratio, according to projections from the Congressional Budget Office (CBO), of 98.2 percent in FY 2023, but the long-term outlook isn’t good. The CBO projects that debt held by the public will rise from 100.2 percent of GDP in FY 2024 to 180.6 percent in FY 2050. Under alternative scenarios, debt could be as high as 205.4 percent of GDP to 250.2 percent of GDP, depending on interest rates or the crowd-out effect on private investment.
Now, the United States—the world’s largest economy—has more elasticity than Greece, Italy, and other countries that have experienced or may experience sovereign debt crises. We also have a lot more to lose, considering that the Dollar is the world’s reserve currency and the growing cooperation between Brazil, Russia, India, China, South Africa, and other countries. This economic alliance, known as “BRICS,” is meant to challenge the G7, which includes the United States. Essentially, BRICS is an emerging economic threat that could see its influence catapulted should the United States enter a period of decline because of our inability to address our fiscal issues. BRICS has previously expressed the idea of toppling the Dollar as the world’s reserve currency.
Consider that Fitch downgraded the United States credit rating in August because of “expected fiscal deterioration over the next three years, a high and growing general government debt burden, and the erosion of governance.” To put this in other words, Fitch said that Congress can’t get its act together to govern effectively enough to avoid our fiscal problems. Although Moody’s hasn’t lowered the United States credit rating, the agency did downgrade our fiscal outlook to negative.
Another concern is “debt drag.” The United States is already expected to experience tepid economic growth in the coming years, but the growing debt could exacerbate that already slow growth. Once the debt reaches a certain percentage of GDP, it can negatively impact economic growth. It’s hard to say where this point is, as some have said debt drag begins once debt reaches 77 percent of GDP or as high as 90 percent of GDP. The size of the United States may also create some elasticity, but it’s hard to argue that we’re not experiencing some effects of a debt drag now.
Congress Wasn’t Exactly Fiscally Responsible Before the Pandemic
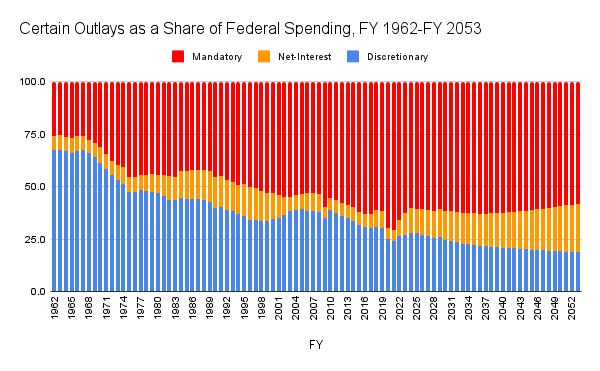
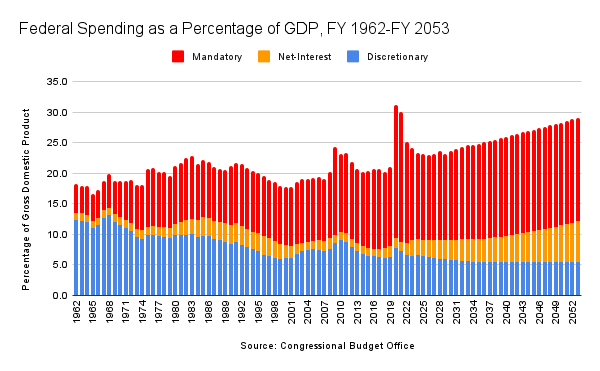
Federal spending is broken into three basic categories—mandatory (also known as “direct spending”), net interest, and discretionary. Mandatory spending is generally based on the number of enrollees or beneficiaries in a program. These programs include Medicare, Medicaid, Social Security, the Children’s Health Insurance Program, federal employee and military retirement programs, and veterans’ programs. Net interest is the cost of servicing the debt after interest income received by the federal government.
Finally, there’s discretionary spending, which is split into defense and nondefense (or “security” and “nonsecurity”). When there’s talk of or worry about a government shutdown, the conversation is exclusively about discretionary spending.
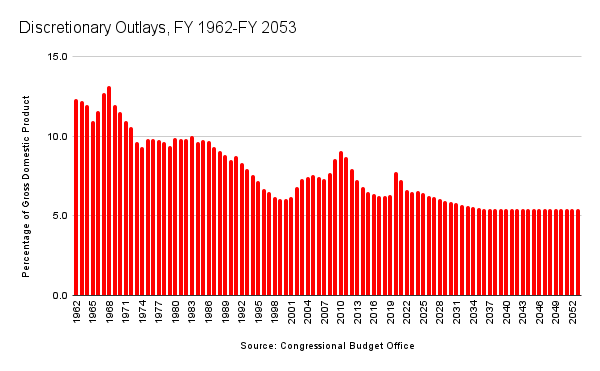
Not only has Congress done absolutely nothing to modernize trust fund programs like Social Security and Medicare, but increases in discretionary spending have been a bipartisan problem. In the 1990s, divided government brought discretionary spending down as low as 6.0 percent of GDP, the lowest level between FY 1962 and FY 2022.
However, President George W. Bush increased discretionary spending, partly because of the wars in Afghanistan and Iraq. The discretionary spending increases under President Bush weren’t limited to defense spending. Nondefense spending increased as a percentage of GDP as well, above the levels in the late 1990s. As an aside, President Bush also created a new mandatory spending program, Medicare Part D (also known as the “Medicare prescription drug benefit”).
President Bush was in office at the beginning of the Great Recession and oversaw the beginning of the fiscal policy response to it. Discretionary outlays increased even more under President Barack Obama, whose own aggressive fiscal policy response produced, at the time, the largest budget deficits since 1945, the last year of World War II. Once again, though, the divided government that began in January 2011 began to push down discretionary spending. The fiscal policy response to COVID-19 meant increases in discretionary spending, but much of the response to the pandemic came through mandatory programs.
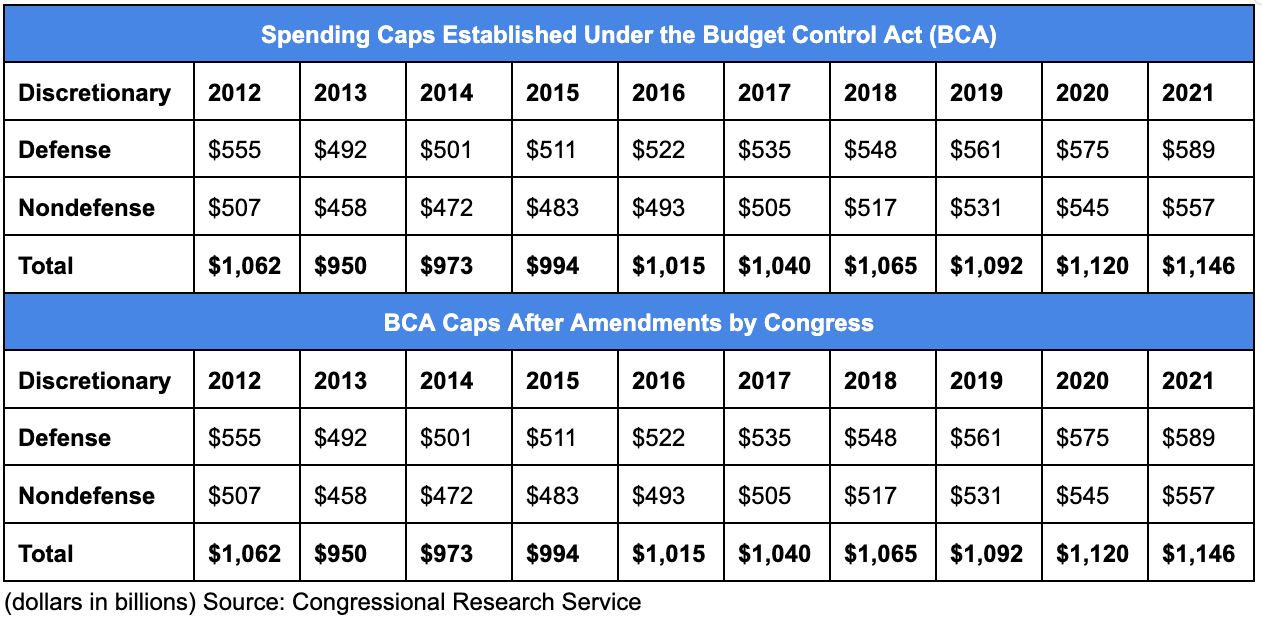
Divided government brought us the Budget Control Act (BCA). The BCA, although not ideal, was an accomplishment because it reduced discretionary spending through automatic cuts because Congress couldn’t reach a bipartisan deal on broader reductions in outlays. Then-Speaker John Boehner (R-OH) called the BCA one of the “steps towards fixing our fiscal problems while President Obama, who signed the BCA into law, pledged to veto any attempt to undermine the cuts. Because defense spending was included in the reductions, Boehner and Republicans got nervous and began to call for rolling back some of the spending cuts. President Obama didn’t veto any of the legislation to roll back the cuts.
Initially, in December 2012, Congress only delayed the looming spending cuts, through the American Taxpayer Relief Act. Soon after, Congress passed four budgets that increased discretionary spending levels. Those bills were the Bipartisan Budget Act of 2013, the Bipartisan Budget Act of 2015, the Bipartisan Budget Act of 2018, and the Bipartisan Budget Act of 2019. The biggest increases in discretionary spending came in the Bipartisan Budget Act of 2018 and the Bipartisan Budget Act of 2019, both of which were signed into law by then-President Donald Trump. Those two bills alone increased discretionary spending by $616 billion from FY 2018 through FY 2021. Congress also used accounts not subject to the spending caps to appropriate more money for defense.
We should note that even with the increases, discretionary spending increases during the Trump administration were stable relative to GDP between FY 2018 and FY 2019. The large increases in discretionary spending occurred as Congress responded to the COVID-19 pandemic when discretionary spending jumped from 6.3 percent of GDP in FY 2019 to 7.7 percent in FY 2020. Even today, discretionary spending is still higher relative to GDP, at 6.5 percent in FY 2023, than it was in FY 2019.
Discretionary spending has to be part of the equation when it comes to spending reforms, but, in FY 2023, discretionary spending represented only 27 percent of all federal spending. The remaining 73 percent of federal spending has been ignored by most members of Congress.
Cutting Discretionary Spending Alone Won’t Solve the Problem
Conservatives in Congress have spent a substantial amount of time on spending cuts in the appropriations bills for FY 2024. Generally, conservatives were opposed to the Fiscal Responsibility Act (FRA), which suspended the debt limit in exchange for caps on discretionary spending.
The FRA reduces discretionary outlays by $170 billion between FY 2023 and FY 2024 and roughly $715 billion from FY 2024 through FY 2029. Including savings on interest payments to finance debt, the deficit is projected to decline by $1.523 trillion over ten years. The cuts to discretionary spending are also important because they bend the baseline for discretionary spending downward.
Now, these projected reductions in discretionary spending and corresponding debt come with some caveats. First, Congress has to stick to the caps to avoid a repeat of the BCA. Otherwise, the savings will be gradually diminished. The BCA still resulted in less spending than projected before its passage, but the savings were limited before being completely wiped away because of the fiscal response to the pandemic.
Second, although the FRA reduces cumulative budget deficits by $1.523 trillion over ten years, FY 2024 through FY 2033, deficits will still total nearly $18.8 trillion over the period. The pre-FRA cumulative budget deficit over the same ten-year window was projected at $20.314 trillion.
Third, discretionary spending represents 27 percent of all federal spending. That’s a lower share than in FY 2019, before the pandemic, when it came in at 30 percent. The average of discretionary spending from FY 2001 through FY 2022 was 34 percent of all federal spending.
Admittedly, this isn’t a good metric for years in which Congress has provided a fiscal response to a recession because mandatory spending is usually boosted, thus pushing discretionary spending downward in its total share of federal spending. Discretionary spending relative to GDP is the better measure.
Finally, even before the FRA, the CBO projected that discretionary spending as a percentage of GDP would decline from 6.5 percent in FY 2023 to 5.6 percent in FY 2033. That downward trajectory is projected to continue well past FY 2033.
Why do most conservatives focus on discretionary spending? Since mandatory outlays and net interest spending are on autopilot and grow based on obligations, these two categories of federal spending are separate from the appropriations process, which covers discretionary spending. When you hear that Congress is considering a budget or debating one of the 12 appropriations bills, that’s discretionary spending.
To be clear, discretionary spending, in real dollar terms, isn’t an insignificant sum. In FY 2023, discretionary spending came in around $1.712 trillion. That’s a sum that’s almost as large as the entire GDP of Russia and Mexico, and it’s larger than the economies of Australia, Spain, and Saudi Arabia. If it were its an economy, discretionary spending would come at #13 or #14, either ahead of or right behind South Korea, the economy of which is $1.71 trillion. But again, discretionary spending was 27 percent of $6.354 trillion of federal outlays.
The 12 appropriations bills have become a convenient place for the margins of both parties to message to their base. In recent years, this means either including language on hot-button cultural or social issues in the base legislative text of an appropriations bill or offering an amendment to insert such language into an appropriations bill. Even if a member knows his or her amendment won’t make it into law, the potential for attention or the perception of fighting is attractive.
The appropriations process is also more appealing to members because addressing the drivers of budget deficits and debt—trust fund programs and interest on the debt—is politically difficult and risky if there’s not bipartisan buy-in from inside and outside of Congress.
Trust Fund Programs Face Automatic Cuts Unless Congress Modernizes Them
One of the strangest aspects of the letter tweeted by Social Security Works and signed by more than 100 progressive groups is the claim that they “consider support for a debt commission to be support for cutting Social Security.” The failure to modernize Social Security guarantees benefit cuts. We know this because the Board of Trustees for the Old-Age and Survivors Insurance and Federal Disability Insurance Trust Funds tells us that’s what we can expect.
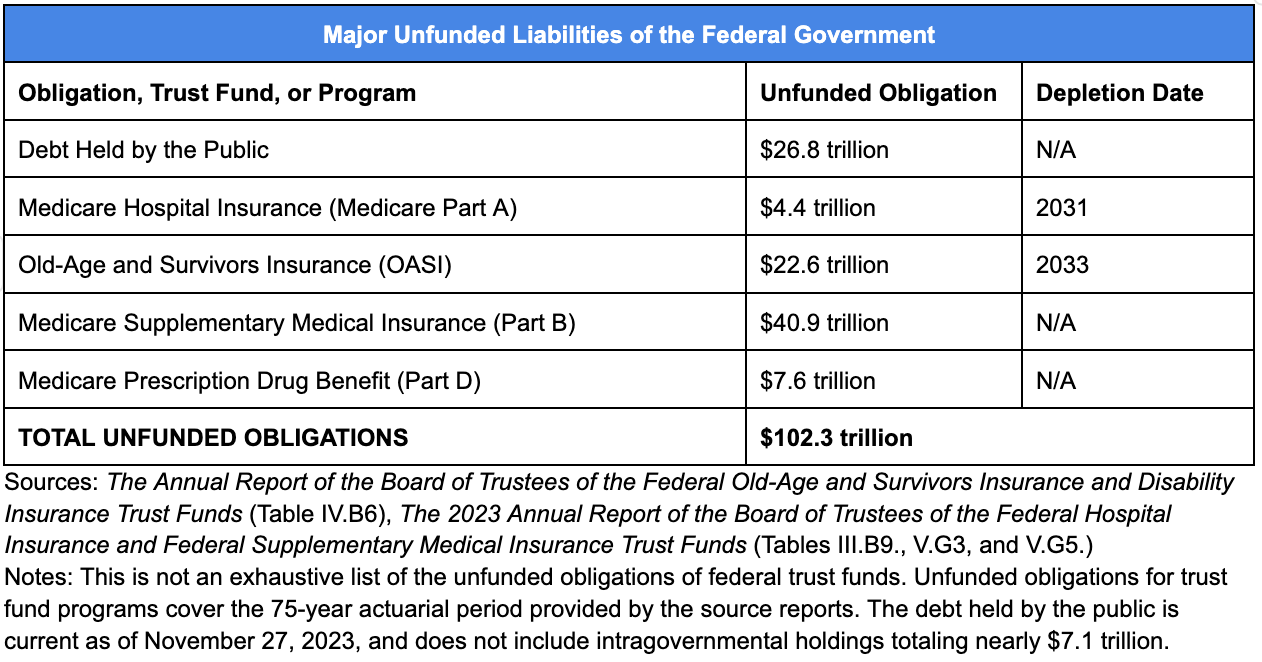
The board publishes an annual report detailing the finances of the Old Age and Survivors Insurance (OASI) Trust Fund and the Federal Disability Insurance Trust Fund. The report provides us with long-term projections, over a 75-year window, and an even longer projection for the “infinite horizon.” The most recent report, published earlier this year, provides a dire warning. The report states, “Considered separately, the OASI Trust Fund reserves become depleted in 2033, one year earlier than projected in last year’s report[.]”
What happens when the OASI Trust Fund becomes depleted? Well, if Congress does nothing, the OASI Trust Fund will be able to pay only 77 percent of scheduled benefits. So, beneficiaries of the program would see an immediate benefit cut, which is why the Board of Directors of the OASI Trust Fund “recommend[s] that lawmakers address the projected trust fund shortfalls in a timely way in order to phase in necessary changes gradually and give workers and beneficiaries time to adjust to them.”
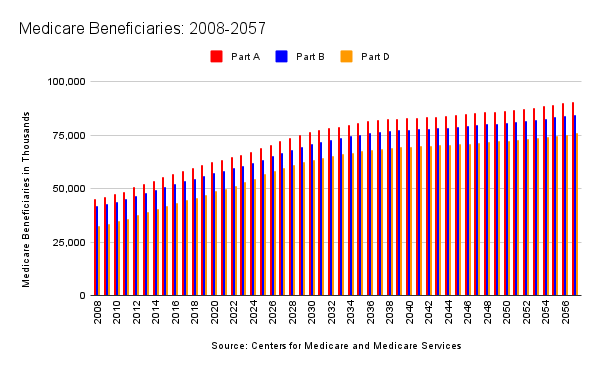
The growth of Medicare and Social Security is predominately caused by the retirement of Baby Boomers. In 2010, nearly 48 million people were enrolled in Medicare programs and almost 44 million received OASI benefits. In 2023, more than 66 million people were enrolled in Medicare programs and more than 58 million received OASI benefits. Those numbers will continue to grow. Medicare is projected to exceed 80 million beneficiaries in 2034 and 90 million in 2056.
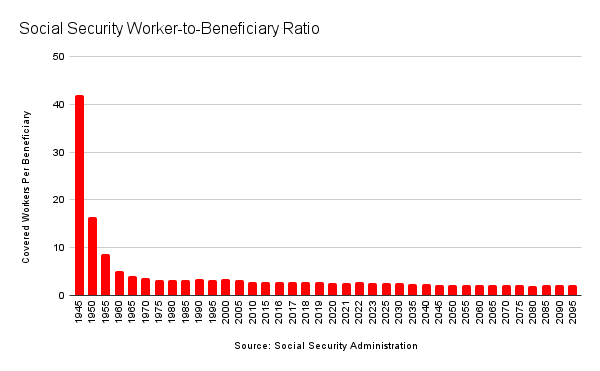
OASI beneficiaries will exceed 70 million in the early- to mid-2030s. Highlighting the concerns with the rapid growth of programs that urgently need to be modernized is the number of workers who contribute to these programs.
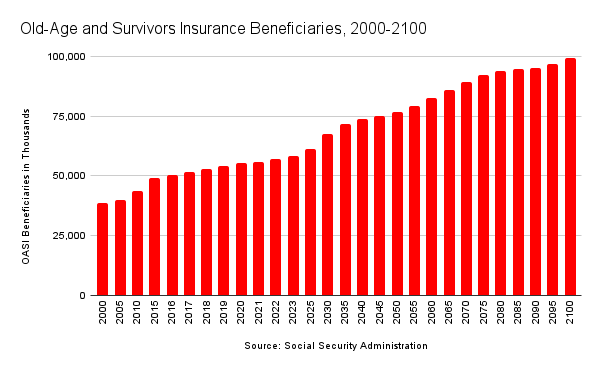
The worker-to-beneficiary ratio for Social Security has declined from 4 workers per beneficiary to 2.7 in 2023. The number of workers per beneficiary will fall to 2.3 in 2035. We’ll discuss the underlying concern with the lack of workers later.
Congress could also bail out the OASI Trust Fund through general revenue transfers similar to how the trust funds were made whole to offset lost revenue caused by the temporary payroll tax cut in 2011. Sec. 101(e) of the American Jobs Act of 2011 authorized the transfers of funds to the Social Security trust funds to cover the lost revenue. This, however, wouldn’t address the structural issues that come with a program originally designed in the 1930s and last modified 40 years ago when Congress faced a similar crisis.
Looming insolvency isn’t limited to the OASI Trust Fund. The Medicare Hospital Insurance Trust Fund (Medicare Part A) faces insolvency even sooner than OASI. The most recent projection is that the Hospital Insurance Trust Fund will be depleted in 2031, at which point the trust fund will be able to pay only 89 percent of scheduled benefits. Part A is the only part of Medicare financed through taxes. Parts B and D are primarily financed through transfers from the general fund of the Treasury and premiums.
The growth of Medicare and Social Security, by the way, is one reason why discretionary spending has gradually declined over time. Look back to FY 1983. That was the last time discretionary spending reached 10 percent of GDP. President Ronald Reagan gave congressional Democrats increases in domestic spending with congressional Democrats to get the defense spending increases he wanted. Mandatory spending—including outlays for Medicare and Social Security—averaged 9.4 percent of GDP between FY 1981 and FY 1990. Mandatory spending in FY 2024 is projected to be equal to 14.3 percent of GDP. In 2033, mandatory is projected to rise to 15.5 percent of GDP. The CBO projects that mandatory spending is projected to reach 16.8 percent of GDP in FY 2050.
Total federal spending relative to GDP is projected to reach 28.3 percent of GDP in FY 2050 and 29.1 percent in FY 2053. Depending on certain factors, the CBO projects that total federal spending as a percentage of GDP could be as high as 37.7 percent. From FY 1962 through FY 2021, federal spending averaged 20.4 percent of GDP while revenues averaged 17.3 percent. The average budget deficit was 3.1 percent of GDP.
Revenues haven’t been mentioned until this point because a) there’s an overdependency on revenues as an answer to federal budget deficits, b) revenues have been on an upward trend, and c) the upward trend in revenues is expected to continue. Some have floated the idea of a more progressive individual income tax system while arguing that the United States has seen top marginal individual income tax rates above 90 percent in the past. For context, the top marginal income tax rate today is 37 percent.
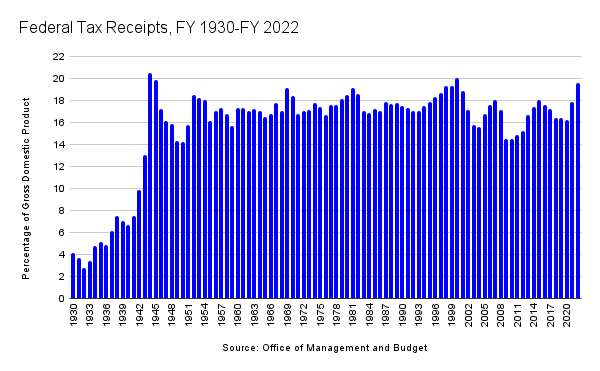
The United States has indeed seen top marginal income tax rates above 90 percent in our history, but revenues as a percentage of GDP have never exceeded 20.5 percent of GDP, and that came in FY 1944 during World War II. Although the top marginal tax rate at the time was 94 percent, one had to earn $200,000 in nominal dollars ($3.3 million in 2022 dollars.) On the low end, the marginal rate was 23 percent on incomes less than $2,000 (or less than $33,265 in 2022). If top marginal rates were that high, why weren’t revenues larger? Well, tax avoidance is one reason, but others include tax deductions and exemptions. One side effect of the unprecedented economic intervention of the 1930s and 1940s was the creation of employer-sponsored health insurance, which wasn’t subject to taxation.
Six of the top ten years of revenues measured by GDP have occurred since FY 1997. Four of those years were FY 1997, FY 1998, FY 1999, and FY 2000. At the time, the top marginal income tax rate was 39.6 percent. Annual economic growth in those four fiscal years exceeded 4 percent. President Bill Clinton and a Republican-controlled Congress also balanced the budget in each of those fiscal years. Despite the bitterness over impeachment, the United States saw strong economic growth and four of the top ten years of revenues measured by GDP in its history. The point is that high tax rates don’t necessarily translate into significant revenues for the federal government. However, not all taxes are created equal. Some taxes are worse than others. After tax credits and deductions, in 2019, 42 percent of Americans paid no income taxes or were in the territory of negative income taxes. However, the payroll tax is regressive because everyone who works pays it, regardless of income.
Looking at CBO projections, revenues are projected to grow. Some years in the future would fall into the top ten should the projections turn out accurate. Revenues, though, while growing relative to GDP won’t keep pace with the rates of spending growth in Medicare and Social Security. Modernization of these programs, while protecting current beneficiaries and those who will be beneficiaries within a reasonable timeframe—say, the next five years—is the only real option.
Some conservatives, including at least one Republican presidential candidate, have expressed the viewpoint that annual economic growth above 3 percent would solve the United States’ fiscal woes. Annual economic growth above 3 percent would be a welcome development. Unfortunately, annual GDP growth of 3 percent or higher has become increasingly rare. Before 2021, when annual economic growth reached 5.8 percent, the last year that the United States saw annual GDP growth above 3 percent was 2005. Keep in mind that 2017 through 2019 saw unprecedented deregulation and significant individual and corporate income tax cuts. Even with these pro-growth policies, annual economic growth didn’t exceed 2.9 percent. Spending was also much lower relative to the GDP than it is today.
We should maximize economic growth to the extent practicable. However, annual economic growth higher than 3 percent won’t come close to solving the fiscal issues that face the United States. Those who say otherwise are, frankly, not being honest.
Interest on the Debt Is Skyrocketing
Before the pandemic, spending on trust fund programs was the fastest-growing aspect of federal outlays. Because of rising interest rates and the increasing reliance on debt to cover federal spending, spending on net interest has overtaken trust fund programs. This reliance on debt to cover spending brings concerns that are much larger than federal spending.
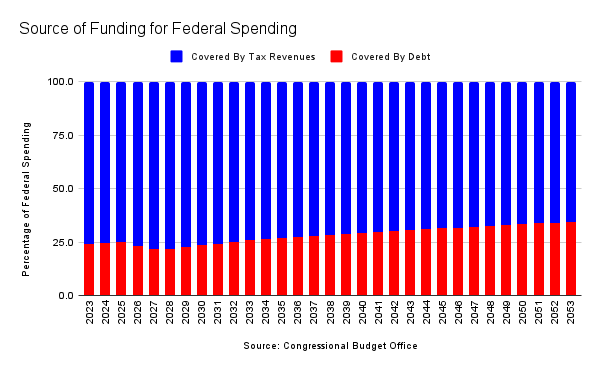
In FY 2023, the federal government collected enough revenue to cover 76 percent of federal spending. As recently as FY 2015, 88 percent of revenues covered federal spending. Unfortunately, presidents from both parties and Democrats and Republicans in Congress have been less concerned about running up the United States’ credit card. Over time, revenues, while higher than in recent years, won’t keep pace with spending growth. Revenues will cover an even smaller share of outlays, declining to roughly 71 percent in FY 2040 and 65.5 percent in FY 2053.
Spending on net interest on the debt remained under 2 percent of GDP between FY 2002 and FY 2022, but increases in interest rates to combat inflation have caused corresponding increases in projected outlays for net interest. Spending on net interest will likely eclipse defense discretionary spending within the next ten years and surpass total discretionary spending in FY 2047. Over time, based on current projections, outlays for net interest will surpass outlays for Medicare in FY 2046 and Social Security in FY 2051.
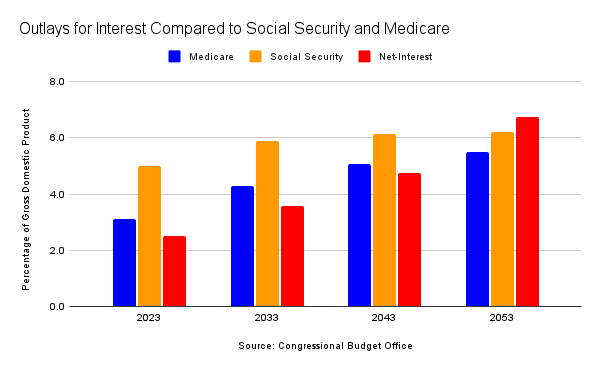
In FY 2015, spending for net interest was 6 percent of federal spending. The growth of federal spending, driven by trust fund programs, began to increase that share to 7.6 percent in FY 2022. The continued growth of federal spending, more rapid than in recent years, and increases in interest rates will dramatically increase the share of federal spending on net interest, from 10.5 percent in FY 2023 to 14.4 percent in FY 2033. In FY 2053, the share of federal spending on net interest is projected to reach 23.2 percent.
An important caveat is that interest rates may also deviate from the current projections. If, for example, the major credit agencies further downgrade the United States’ credit rating, interest rates for Treasury securities to finance new debt may rise to make them attractive to investors. Meanwhile, as existing securities mature, existing debt will be rolled over into new Treasury securities at higher rates. Rollover of existing debt is included in the current projections.
Higher interest rates to finance debt may sound exceedingly boring, but there’s a microeconomic effect that should concern us. Because the federal government sells these securities to finance debt, it’s in direct competition for capital with businesses and individuals. Treasury securities are generally seen as a safe investment.
In times of economic uncertainty, investors will be more willing to buy Treasury securities. This will crowd out private investment, leaving less capital for borrowers. Less capital in the private market means less business investment, which translates into lower economic growth, stagnant incomes for workers, and fewer opportunities for those looking for work. It also means higher interest rates for cars and homes, thus pushing down demand because the cost of financing will make such purchases unaffordable. In October, yields (interest rates) on 10-year Treasury securities reached 4.98 percent at close. Although those yields have fallen to 4.32, 10-year yields are higher today than at any point in the past five years. Highlighting the impact that Treasury yields can have, mortgage rates reached 8 percent at the same time.
The resistance to the modernization of trust fund programs like Medicare and Social Security and failure to come to the table to discuss ways to make these programs sustainable is contributing to the inevitable sovereign debt crisis that will lead to an even less stable United States. It’ll also severely inhibit responses to emerging national security and domestic policy responses to events that may unfold.
American Society Is Getting Older and Will Have Fewer Workers in the Future
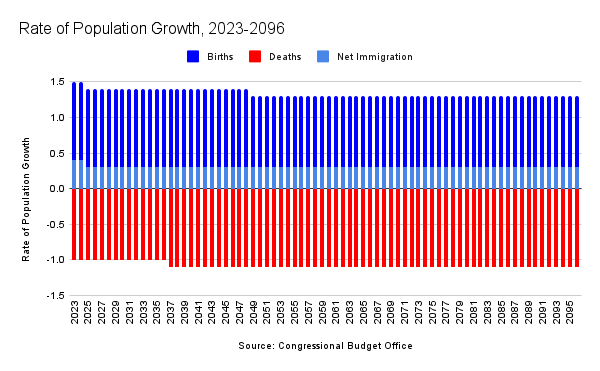
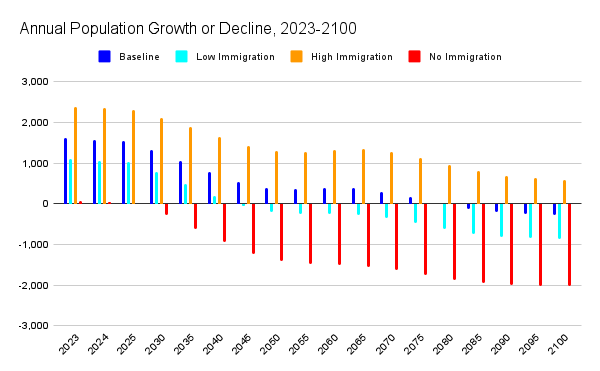
Based on current population growth projections, the United States will see more deaths than births in 2043. From this point forward, the only growth in our population will come from net immigration. That’s a reality. Population growth has slowed for decades because of declining birth rates. This is a common theme among countries across the world, including industrialized nations. Some countries have developed policies that provide financial incentives for the birth of children, thus far to no avail.
So, why does this matter? Well, it matters predominately because the slowing rate of population growth has economic implications. Fewer workers mean fewer people contributing to the economy, which translates to less economic output. Fewer workers also mean fewer people paying taxes, including contributing to the OASI Trust Fund and the Hospital Insurance Trust Fund.
Based on CBO projections, the United States will see as many births as deaths in 2042. From that point forward, the population growth will come entirely from net immigration.
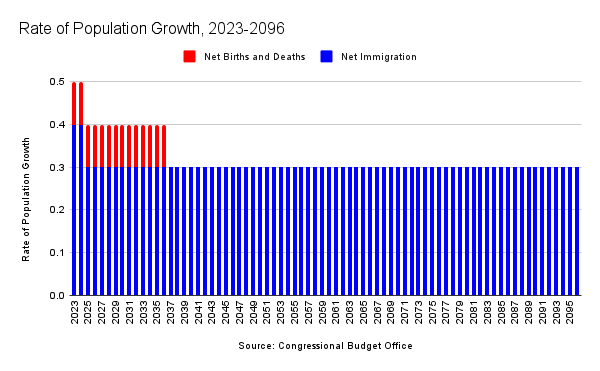
Looking at this another way by factoring in deaths with births to create a category of “net births and deaths.” You get a clearer picture of the point. Again, this is slow population growth, and it’s driven entirely by net immigration in 2042 and after.
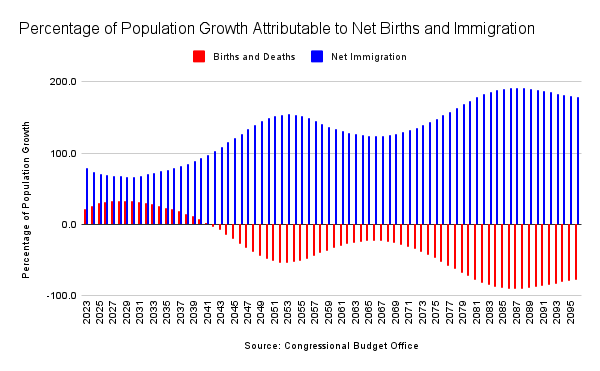
And you can see the percentage of growth attributable to births and immigration by year through 2096.
Although the United States population will grow, albeit at a slow rate, a projected shift in age demographics is expected to occur over the next 30 years. In 2023, for example, 51.5 percent of the population is age 39 or younger. However, in 2033, that is projected to decline to 49.1 percent. In 2053, 46.3 percent of the population is projected to be age 39 or younger. At the same time, the population aged 60 and older is projected to grow from 23.8 percent in 2023 to 28.5 percent in 2053. The growth of the population over age 60 or older will put a strain on social insurance programs like Medicare and Social Security unless those programs are modernized to sustain the influx of beneficiaries.
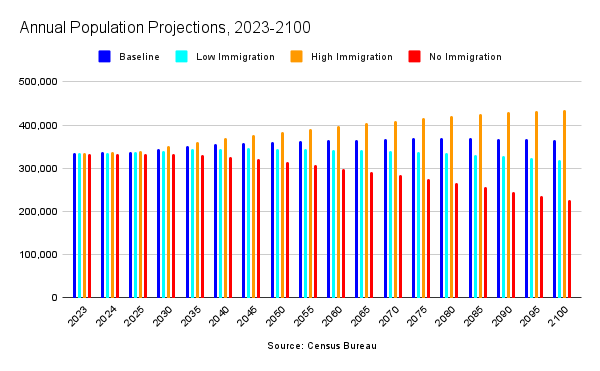
These projections are based largely on current levels of immigration growth. That could change if Congress changes immigration policies. The debate over immigration in Congress is ongoing, with most of it being focused on border security. Unfortunately, the rise of restrictionism has made consensus on the modernization of the United States’ immigration laws virtually impossible to find. Still, we have an idea of what to expect under certain scenarios.
As it stands right now, under the baseline of population projections, the population of the United States will continue to grow through 2080. From 2081 through 2100, the population will decline. If immigration were stopped altogether, the population decline would begin in 2025. Yes, 2025. If immigration were reduced to low levels, the decline in population growth would begin in 2044. However, if the United States were to maximize immigration, there wouldn’t be any decline in population growth.
Conclusion
If Congress establishes a fiscal commission, that’ll be only one step. We’ve been down this road before via the National Commission on Fiscal Responsibility and Reform (“Simpson-Bowles”) established in 2010 by President Obama and the Congressional Joint Select Committee on Deficit Reduction established in 2011 by the Budget Control Act (the so-called “Supercommittee”). Simpson-Bowles offered substantial spending and tax reforms, but Congress never truly debated the recommendations. The Supercommittee wasn’t able to agree on reforms.
The short is that an outcome that produces recommendations to address the serious fiscal issues that the United States faces—the structural, long-term deficits and the alarming growth of the share of the debt held by the public—isn’t guaranteed. Any recommendations aren’t guaranteed to pass Congress, but the effort has to be made. It’s a necessity. Too many years of kicking the can down the road have brought us to this point. It was predicted, but Congress nearly always opts for political expediency, with few exceptions.
That reality being noted, each and every member of Congress—those currently serving and former members—was aware of the fiscal realities that the United States now must confront. We’ve reached the point at which Congress can’t kick the can down the road any longer. We’ve run out of road. This process isn’t going to be easy. Preserving benefits for current beneficiaries, as well as those who will soon retire, has to be a priority. However, we have to realize that trust fund programs aren’t sustainable and begin to determine the ways to address the impending depletion of trust fund programs.
Obviously, this is easier said than done. In an era of hyperpartisanship, there are significant incentives to keep Americans divided along party and ideological lines. It’s hard for fringe members of both parties to get on camera or raise money if there’s consensus inside Congress. Catering to the fringes, though, won’t solve the fiscal issues that face the United States. The solutions to put the United States on a fiscally sustainable path have to be bipartisan and grounded in consensus for them to have credibility with the American public.
As mentioned, the United States economy has more elasticity than Greece, Italy, and other countries that have faced sovereign debt crises, but that elasticity does have a limit. When that limit is reached, Americans will endure a severe sovereign debt crisis that could have been avoided if Congress had done its job.
Each day that passes us by without action is a day that takes us closer to insolvency.
Related Content


FreedomWorks Letter to Congress in Support of the Fiscal Commision Act (H.R. 5779)
FreedomWorks Letter to Congress in Support of Fiscal Commision Act (H.R. 5779)